|
|
||
|
Fig 1
|
Fig 2
|
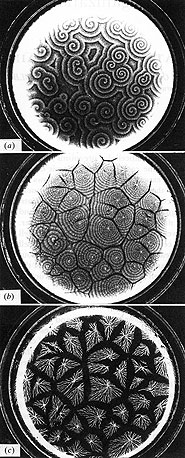
Cell streaming in the slime mold Dictostelium discoideum
The slime mold Dictyostelium discoideum serves as an excellent paradigm for morphogenesis in higher organisms as it exhibits the processes of signal transduction, signal relay, cell movement and aggregation. In one of the first models which couples cell motion with biochemistry, we showed the formation of cell streams. The resultant model, a system of coupled nonlinear partial differential equations, is amenable to analysis to determine the wavelength of the streams (using Floquet theory). Furthermore, the model is consistent with a number of experimental observations and suggests a novel explanation for the observation that the wavespeed of signalling waves (of cAMP) change with wave number. See publications 45, 54, 58, 59, 73, 87, 93.
|
|
||
|
Fig 1
|
Fig 2
|
Figure 1. Aggregation of Dictyostelium discoideum on an agar plate showing the formation of spiral cAMP waves which induce (a) cell movement, (b) the onset of cell streaming, and (c) the development cell stream morphology in the whole aggregation territory; pictures taken ca. 30 min apart, the diameter of the dish is 5 cm. The position of the cAMP waves in (a) and (b) can be inferred from the different light-scattering responses of elongated (moving) and rounded (stationary) cells; amoebae elongate under the influence of the cAMP waves and form bright bands in the dark-field photograph. The strain used (strFNP377) shows particularly large streams due to the inability to form secondary aggregation centres. Picture courtesy of P. Newell. [Reproduced with permission from publication 58]
Figure 2. Numerical simulation of cell streaming in Dictyostelium discoideum under the influence of two signalling centres. Upper panel: cell density (upper row) and cAMP concentration (lower row) for a counter-rotating pair of spiral waves. Lower panel: cell density and cAMP concentration for a spiral wave and a periodic pacemaker (period 6 min). Initial conditions for the spiral waves were appropriately broken plane wavefronts. Snapshots taken at 10 min, 40 min and 100 min; colour scale ranging from black for low values to white for high values: See T. Höfer, Modelling Dictyostelium aggregation, D.Ph. thesis, Oxford University, 1996.
** Work carried out in collaboration with T. Hofer and J.A. Sherratt