This section briefly describes the project that I undertook for my MSci with Kim Christensen to model Atrial fibrillation as a cellular automaton. More information can be found in the article that he and his PhD student published.
What is Atrial Fibrillation?
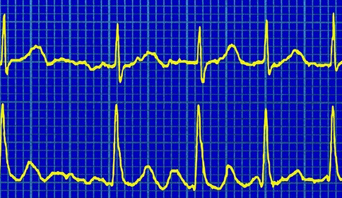
Atrial Fibrillation (AF) is the most common form of sustained cardiac arrhythmia (problem with the heartbeat) in humans [3]. It is characterised by the atria of the heart “quivering” instead of beating regularly, caused by the muscle cells on the atrial walls contracting in a disordered fashion, rather than in sync with each other. This results in reduction of the volume of blood output from the atria. Although this reduction is only of order 10% [1], it can cause clots to form in blood within the atria, which in turn can lead to stroke [2]. Other symptoms include hypertension and chest pains [3]. The figure to the left compares a normal heartbeat (below) to a fibrillating one (above) [4]. You can read more about the clinical details of AF on the NHS's website.
What's a "cellular automaton"?
To put it simply, A cellular automaton is a model that consists of cells with discrete states, whose states are updated every “time-step” based on a set of determined rules. For example, I might have a 2D grid of squares, each with a number "0" in. One rule might be that if your neighbour has a "1" in it, then next time-step, you have a "1", too. If I stick a "1" somewhere in the centre of the grid, I would see a sort of fire spreading out from the starting position.
So what did you model?
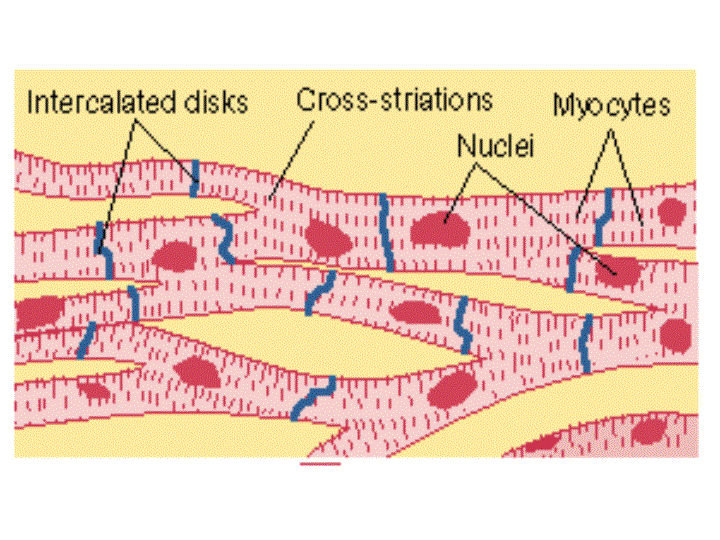
Modelling the heart as a 2D cylinder and sticking the sino-atrial node on one edge, you can see waves spreading across it.
By introducing a chance for individual cells to be defective, and changing the frequency of branches between cardiomyocytefibres, then with certain parameters, atrial fibrillation occurs.
References
G. Ertl et al. The effects of atrial fibrillation on coronary blood flow and performance of ischaemic myocardium in dogs with coronary artery stenosis. Clinical Science, 73(4), October 1987.
Slightly more information can be found at the group's blog.
Why protein interaction networks?
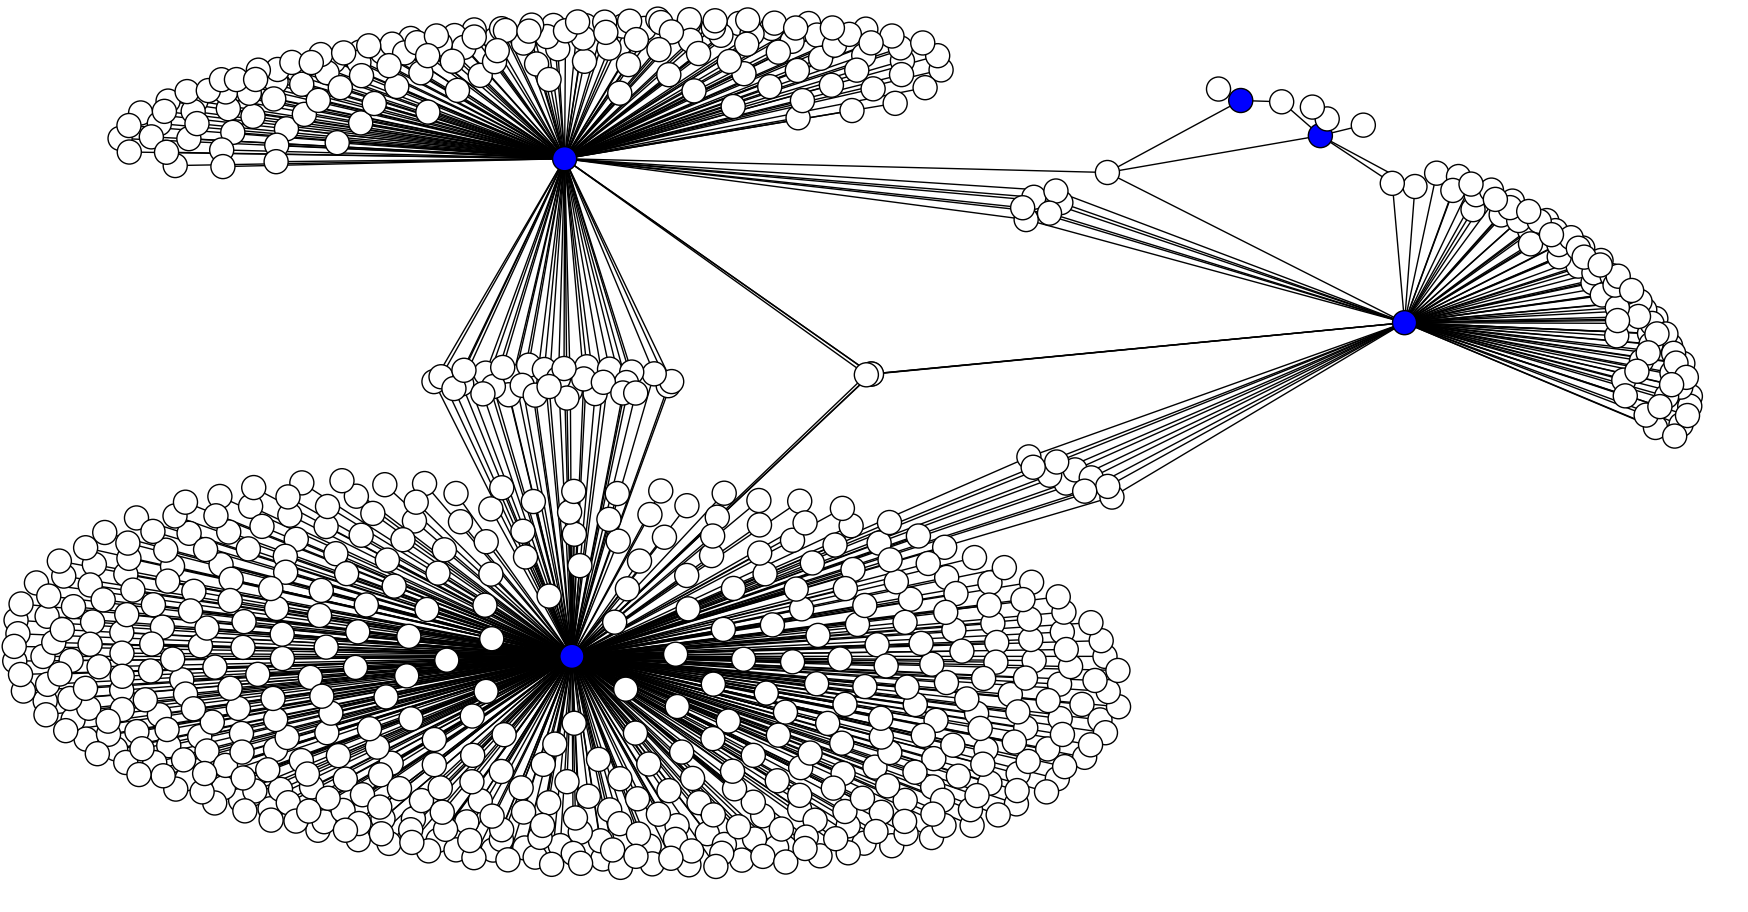
If all of the functions of a cell are carried out by proteins, then intuitively, all of the information about what that cell can do and how it reacts to different situations should be encoded in these proteins and the way they interact with each other. Through various experiments, we can produce a network of all of the protein-protein interactions that we know about. You can then perform community detection on this network, which is an algorithm that splits up nodes into likely groups based on how much they interact with each other compared to everything else.
However, there are two problems with this approach. Firstly, the interaction network represents all of the interactions between proteins, but not all proteins are present in every cell. In fact, these interactions may not occur all the time in the same cell, or at the same strength. The network entirely misses the biological context. Secondly, the techniques that we use to discover interactions are not perfect, leaving us with approximately a 50% false positive rate for edges on the network... and a 50% false negative rate, too. Normal community detection is not robust to this kind of noise.
Gene expression data
The flip side of the coin is to analyse dynamic changes in gene expression by cells after applying some stimulus, like starving them of amino acids. What you end up with is a time course of the expression of all the cells, which you can compare between a perturbed and a control system. However, this only allows you to make binary comparisons, and some of the relationships between pairs of proteins will be weak. This approach is vulnerable to false positives and negatives.
Taking the best of both worlds
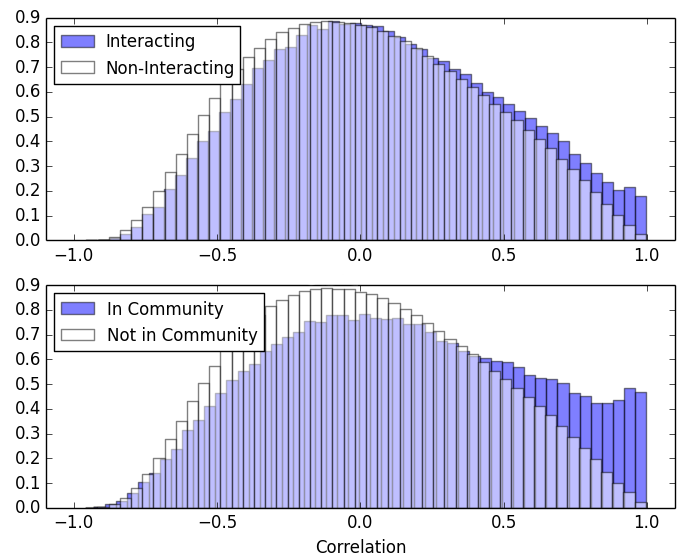
In my project, I investigated ways to combine these approaches. I calculated the correlation between the expression pairs of genes and compared genes that interact or not. I then performed community detection on the protein interaction network and compared the correlation of pairs of genes in the same community or not. What resulted was the figure to the right - which was encouraging!
What about the function of clusters of proteins?
This brings us back to the whole point of this project. We used correlation to try and apply a score to different communities on the network, and looked at how these scores changed between different expression sets. For example, I looked between a control set of expression data in yeast and a set where the yeast was suffering a heat shock. Through this, certain communities gained a higher score... which I hoped meant they had some function to do with heat shock. I ended up with a list of communities with scores that change quite a bit between various conditions. I used functional annotations by some kind hearted experimentalists to try and validate these scores, as well as "borrowing" some code from someone else in the group.
