As the world begins to reopen in the wake of the pandemic, there are many questions that are being asked.
For example, what strategies should be adopted within schools to ensure a safe environment in which to learn?
Can I safely eat in a restaurant? And is it safe to exercise in a gym?
In order to answer these questions, we need to understand how viruses move around in a room.
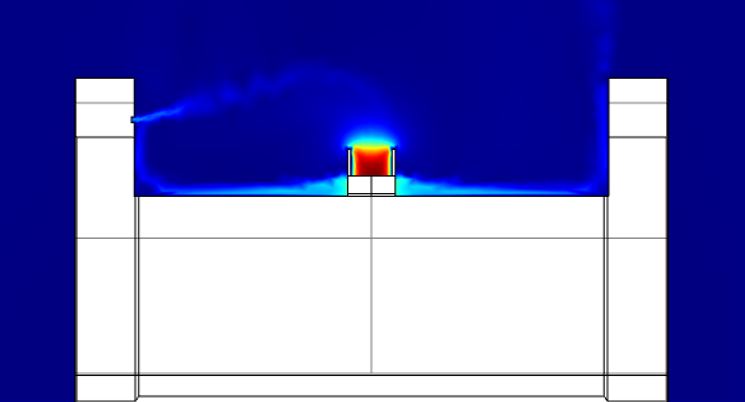
Computational fluid dynamics (CFD) simulations are able to predict the transport of virus particles in the air, which travel in small droplets called aerosols. However, such simulations take a significant amount of time to run, which makes it difficult to use these as a rapid prediction tool to determine the safe behaviour protocols for different classrooms, restaurants or gyms and how these recommendations change if we open windows or switch on air-conditioning units.
A common modelling simplification that enables us to make rapid predictions is to assume that the virus aerosols are well mixed throughout a room. However, the cost with such well-mixed models is that this then removes any of the spatial dependence of the aerosols in the room, which means we would not be able to distinguish between sitting next to an infected person or being on a table far away from an infected person in a restaurant.
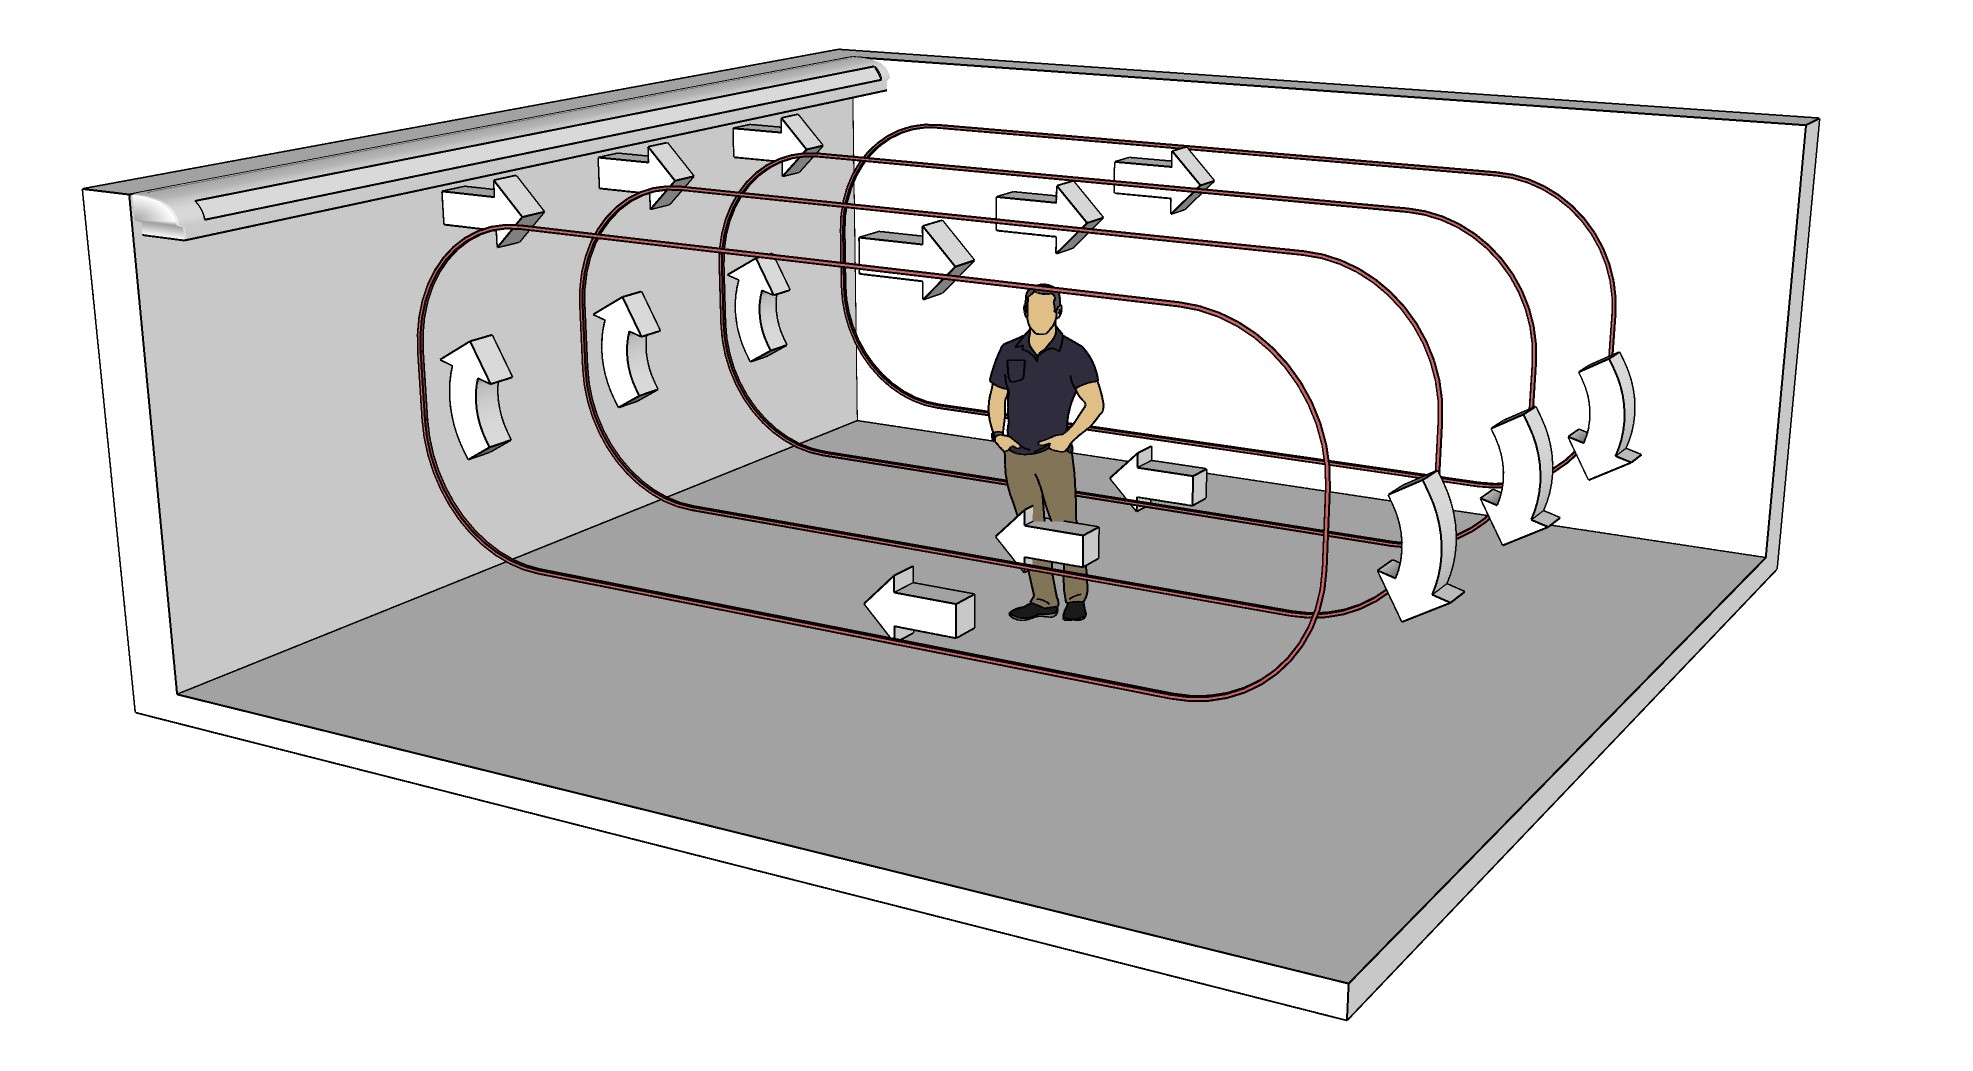
In this project, we have been working for the Welsh Government to develop a model that incorporates the rapid predictions of a well-mixed model with the spatial dependence that is afforded by a CFD simulation. To achieve this, we assume that the virus aerosols are transported by the air flow, which provides a recirculation pattern as shown in the figure above [figure drawn by Siân Grant].
In this room setting, we assume that:
This can be described using the following advection-reaction-diffusion equation:

where C denotes the virus concentration, x is the distance around the
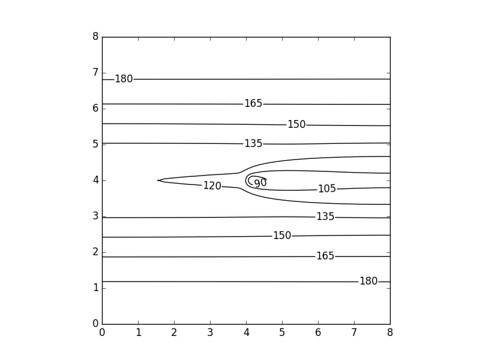
recirculating loop and t is time. This system admits an analytic solution, which allows us to predict virus concentrations in the
room and as a result, safe occupancy times for different locations in the room:
We have built a web app to show how our mathematical models can predict safe occupancy times given different mitigation strategies. You can try this for yourself here.
You can also visualize airborne virus transmission using VisualPDE You can try this for yourself here.We have also been working with Smart Separations, a start-up company who have developed a novel antiviral coating that they have applied to their air-purifiers which can then remove coronavirus from the air. Here, we are asking the question of how such air-purifiers in rooms can reduce the concentration of airborne virus particles and moreover how such air-purifiers should be placed in order to maximize their efficiency.